Heatmap Your Way to the Top: Mastering GeoGrid Rank Tracking


A geo grid rank tracker is a specialized tool that simulates searches from multiple geographic points to create a heatmap of your local search rankings. Instead of checking your rank from a single, static point, it shows you exactly where your business appears in Google's local pack and organic results from every corner of your service area.
How a Geo Grid Rank Tracker Works:
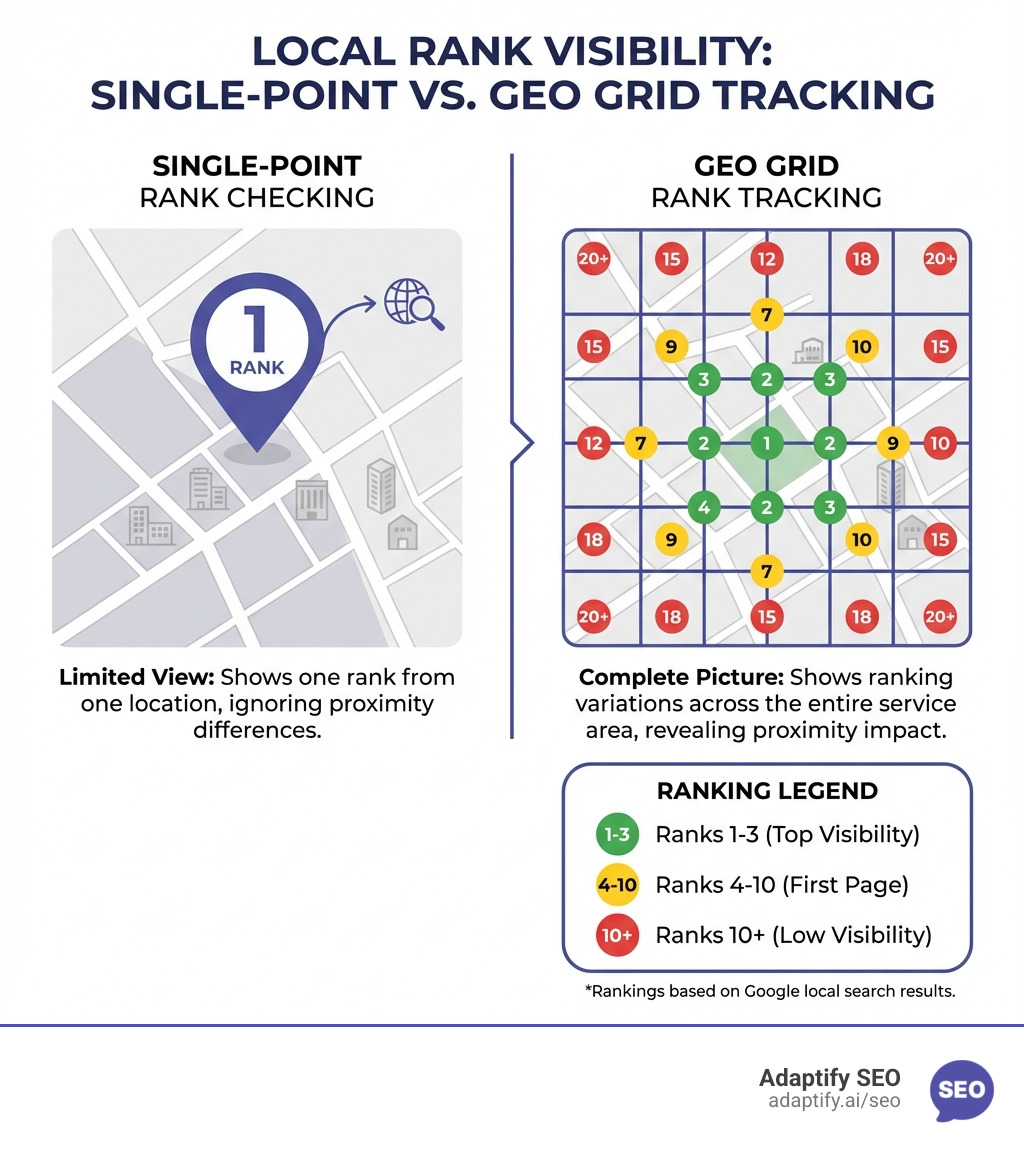
This matters because Google's algorithm heavily prioritizes proximity. A business might rank #1 at its doorstep but be invisible just a few blocks away. Traditional rank trackers only check from one point, giving you a false sense of your actual visibility across your entire market.
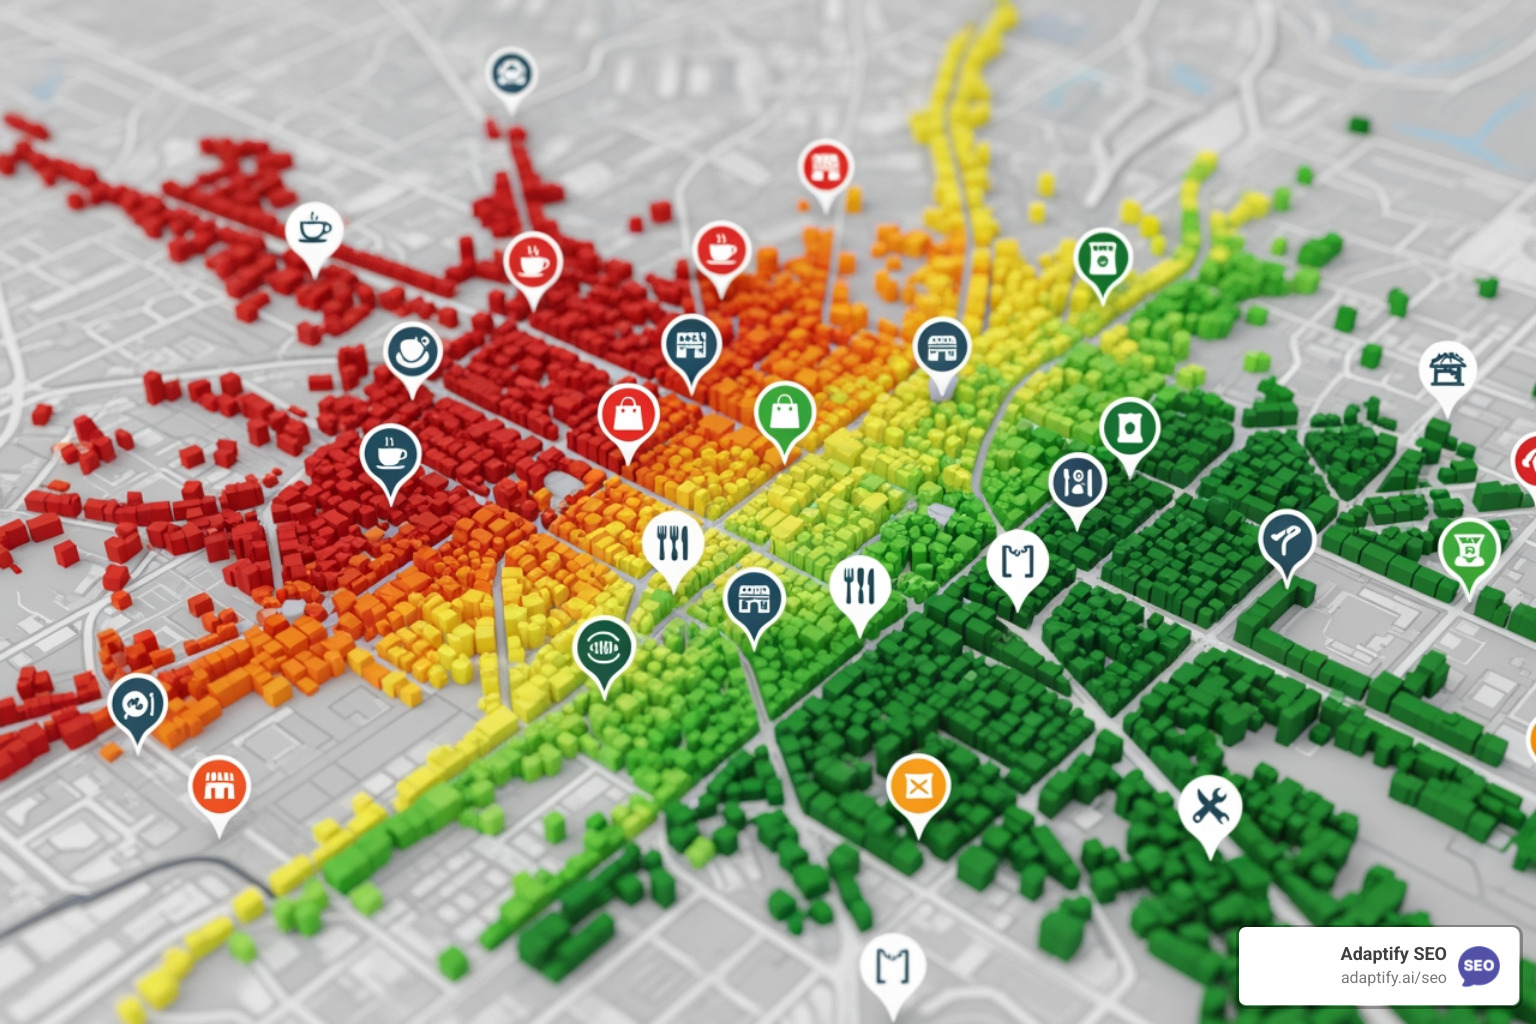
The reality is stark—a customer searching "coffee shop near me" from the north side of town will see completely different results than someone searching from the south side. Without geo grid tracking, you're flying blind.
I'm Hansjan Kamerling, and with over a decade in SaaS and AI, I've seen how geo grid rank trackers transform agencies from guessing about local presence to making precise, data-driven decisions that dramatically improve client results.
As I mentioned, a geo grid rank tracker is a game-changer because it moves beyond the limitations of traditional rank tracking. Google's local algorithm has radically changed, with proximity weighing heavier than ever. A business's Google ranking isn't a single, static number; it changes based on the searcher's physical location. My research shows that searches like "where to buy" and "near me" have grown significantly, underscoring the critical need for hyper-local visibility. For broader context on how local search works, see Google's documentation on local ranking.
So, how does this magic happen? A geo grid rank tracker simulates real-world search queries from hundreds of specific locations within a defined service area. They capture the actual search engine results page (SERP) from each point, noting your business's ranking for specific keywords in the local pack, Google Maps, and organic search results.
This raw data is then transformed into an intuitive heatmap visualization. Green areas typically indicate a strong ranking (top 3), yellow means you're on the first page (ranks 4-10), and red suggests you're on the second page or lower, meaning you're likely invisible to most customers. This color-coded map immediately highlights your areas of strength and weakness.
When it comes to data collection, there are generally two main approaches. Some tools leverage the Google Places API, which is a powerful way to pull business information and rankings. Others use proprietary technology, often to overcome API limitations, such as tracking Service Area Businesses (SABs) or ensuring more robust data accuracy. Regardless of the method, the goal is the same: to provide an accurate, granular picture of your local search performance.
Setting the right grid size and density is a crucial first step, as it directly impacts data accuracy and granularity. Grid sizes are typically expressed as XxY, like 3x3 (9 points), 5x5 (25 points), or even larger, up to 21x21. A 3x3 grid might give a quick overview, while a 15x15 grid provides a much more detailed picture of an entire city.
Point density refers to how close these search points are to each other, often influenced by the radius settings. A 5x5 grid over a 0.1-mile radius will have much denser points than the same grid over a 5-mile radius.
Here's my rule of thumb:
The trade-off is always between granularity and cost. Each grid point typically consumes one "credit" in most tools. So, a 5x5 grid costs 25 credits per scan, while a 15x15 grid costs 225 credits. It's crucial to balance the need for detailed data with the budget.
There is a distinct difference between tracking rankings for physical storefront businesses and Service-Area Businesses (SABs). This distinction is critical because Google handles their local search visibility differently.
Physical Businesses: These have a public-facing physical address (like a restaurant or retail store). Their rankings are heavily influenced by proximity to their exact location. A geo grid tracker shows how their ranking changes as the searcher moves further away.
Service-Area Businesses (SABs): These businesses operate without a physical storefront that customers visit (e.g., plumbers, electricians). They define a service area, and their address is often hidden from their Google Business Profile (GBP). Tracking SABs is a unique challenge because the Google Places API typically only returns businesses with a listed address.
Many geo grid trackers have evolved to address this by offering a "SAB mode" or a proprietary data collection method. This specialized mode allows for accurate tracking of how an SAB ranks across its defined service area, providing visibility into where they are (or aren't) appearing in local search results. Understanding this distinction is vital for accurate tracking and effective local SEO strategy.
Navigating the landscape of geo grid rank tracker tools can feel like a maze, but focusing on key features helps cut through the noise. Look for a tool that provides granular insights, integrates with your workflow, and helps demonstrate tangible results to clients.
The key features to consider include:
Let's dive a little deeper into the specific features that truly make a geo grid rank tracker indispensable for local SEO efforts:
Cost Considerations and Credit Systems: As mentioned, most tools operate on a credit system. Different grid sizes consume a varying number of credits (e.g., a 3x3 grid might be 1 credit, while a 15x15 grid could be 7 credits). It's crucial to calculate your anticipated usage to choose the most cost-effective plan.
Competitor Analysis Features: This is where a geo grid rank tracker truly shines. Tools allow you to plot your clients' top local competitors on the same grid. You can then click on individual nodes to see their rank, explore their Google Business Profile (GBP) listings, and analyze their reviews, categories, and photos. This level of insight helps you understand why a competitor is outranking your client in a specific area.
Tracking Over Time: Local SEO is an ongoing process. A good geo grid rank tracker allows you to schedule recurring scans and stores historical data. This means you can compare current performance against past results, identifying trends and measuring the impact of your optimization efforts. Some tools even offer time-lapsed GIF exports that beautifully illustrate improvements to clients.
SERP Screenshots: Visual proof is golden when presenting to clients. Some trackers provide actual screenshots of the search results for each grid point. This not only verifies the ranking data but also helps explain to clients exactly what a user sees when searching from a particular location.
Automated Scheduling: Manual checks are a thing of the past. Automated scheduling features run scans daily, weekly, or monthly, ensuring you always have fresh data without constant manual input. This frees you up to focus on strategy.
White-Label Reporting: For agencies, white-label reporting is indispensable. It allows you to deliver professional, branded reports to your clients, showcasing their local ranking performance without revealing the tools you use. This improves your agency's credibility and helps demonstrate ROI. For more on the power of branded reporting, you can check out More info about white-label SEO.
The world of local search isn't confined to a single country. It's crucial that the tools you use offer robust international capabilities, especially when working with clients who have a global presence.
Global Support: Leading geo grid rank trackers offer global support, recognizing international Top-Level Domains (TLDs) and adjusting reporting language. This means you can track rankings for a business in Canada, the UK, or Australia with the same precision as in the US.
Language Adjustments: In multilingual regions, the ability to track keywords and results in different languages is a significant advantage.
White-Label Reports: This feature is even more critical for international clients. Providing reports that are fully branded and presented in a language they understand builds trust and professionalism. As one expert declared, this capability is "tremendous."
Export Formats: Flexibility in exporting data is also key. Look for tools that offer various export formats, including PDFs for polished client reports, CSVs for deeper data analysis, and time-lapsed GIFs to visually showcase ranking improvements.
A geo grid rank tracker isn't just about pretty heatmaps; it's about turning those visuals into a roadmap for local SEO success. The goal is to leverage this data to identify untapped ranking opportunities, neutralize competitive threats, and demonstrate a clear return on investment.
When you look at a heatmap, the yellow and red zones are where the real work begins. Those red spots represent visibility gaps—areas where your client is effectively invisible to local searchers. This is a clear ranking opportunity. Conversely, if a competitor is consistently green in a key service area where your client is red, that's a competitive threat you need to address.
Geo grid rank trackers help you see how your client ranks in both the local pack (the map results) and the traditional organic search results. Sometimes, a business might rank well organically but be absent from the local pack in certain areas, or vice-versa. This granular insight allows you to tailor your strategy.
Demonstrating ROI is paramount. The visual nature of geo grids is a superpower. Showing a client a time-lapsed GIF that visually animates their ranking improvements over weeks or months is a powerful, undeniable way to "show, don't tell" the value of local SEO. This feature beautifully illustrates the improvements you have made in local search results.
This data also integrates seamlessly with broader SEO strategies. If you see consistent red spots in a specific neighborhood, it might inform your content strategy to create hyperlocal landing pages or blog posts targeting that area. For more on how to craft effective content, see More info about SEO content.
Your Google Business Profile (GBP) is the cornerstone of local SEO, and a geo grid rank tracker provides the intelligence needed to optimize it effectively. Here's how to use it:
Identifying Weak Ranking Zones: The heatmap visually highlights areas where a GBP listing is underperforming. If you see red zones for "dentist near me" in a specific part of town, you know exactly where to focus your efforts.
Analyzing Competitor Listings: By clicking on those grid nodes, you can see which competitors are dominating those weak zones. Explore their GBP listings. What categories are they using? How many recent reviews do they have? What kind of photos are they posting?
Optimizing GBP Categories: Based on competitor analysis and keyword performance, you can refine your client's GBP categories to better reflect the services Google is prioritizing in those areas.
Localized Content Strategy: If a particular neighborhood isn't seeing your client for a specific service, create localized content on their website or GBP posts that explicitly mention that area and service.
Geo-Tagged Photos: Encourage clients to upload geo-tagged photos to their GBP, especially from locations within their service area, to reinforce their relevance to those regions.
By combining visual insights from the geo grid tracker with a deep dive into competitor strategies, you can make targeted improvements to a client's GBP that directly address their visibility gaps. For guidance on structuring these recommendations, consider reviewing More info about SEO proposals.
A geo grid rank tracker is a powerful component of a holistic local SEO strategy. Use the insights gleaned from heatmaps to inform and refine other aspects of your work:
Informing Local Link Building: If you identify a weak ranking zone, prioritize local link building efforts from businesses or organizations within that specific area. A strong, relevant local backlink profile can significantly boost local pack rankings. For tips on building effective links, check out More info about backlinks.
Creating Hyperlocal Landing Pages: For persistent red zones, a dedicated landing page optimized for keywords and geographic modifiers specific to that neighborhood can be incredibly effective.
Adjusting Service Area Targeting: Geo grid data can prompt a re-evaluation of a defined service area, either to expand into new, promising regions or to intensify efforts in under-served ones.
Proving Campaign Value to Clients: Connect SEO efforts to tangible business outcomes. If a plumber goes from invisible to top 3 in a new housing development, that directly translates to potential new leads and revenue. This visual, data-driven proof is invaluable for client retention.
While geo grid rank trackers are incredibly powerful, it's important to acknowledge their limitations to interpret the data accurately:
Despite these points, the overall value and accuracy of geo grid trackers far outweigh these minor limitations.
This is a common question. The choice of grid size and point density directly influences the detail and scope of your ranking data.
The key is to balance the need for detail with the cost, as each grid point consumes credits. A good strategy is to:
The goal is to get enough accurate data to make informed decisions without overspending.
Competitors are absolutely central to geo grid rank tracker analysis. Without understanding where and how competitors are performing, your own ranking data lacks crucial context.
In today's hyper-localized search environment, traditional, single-point rank tracking is like navigating with a blindfold on. The dynamic nature of Google's local algorithm, heavily influenced by proximity, demands a more sophisticated approach. A geo grid rank tracker is that approach, moving us from guesswork to data-driven decisions.
These tools illuminate the blind spots in a business's local market visibility, providing granular, actionable insights that were previously unattainable. They empower agencies to identify precise ranking opportunities, neutralize competitive threats, and, crucially, demonstrate a clear, visual return on investment to clients.
The future of local SEO is visual and precise. Tools like these provide the granular data that platforms like Adaptify.ai can use to automate and scale effective local SEO strategies for agencies. By understanding your local search performance across every corner of your service area, you're not just tracking rankings; you're visualizing your path to local success.
Ready to stop guessing and start seeing your true local rankings? Try our SEO platform today.

Learn about ai visibility tracking platforms for brands aeo geo tools.

AI in SEO Is Here to Stay Here’s What Actually Matters - Learn about ai in seo

Discover how SEO agencies technology integration with AI tools and automation boosts efficiency, ROI, and search visibility in 2026.
Join 1,000+ agencies already delivering SEO and AI visibility from a single platform without increasing their headcount.Join 1,000+ agencies already delivering SEO and AI visibility from a single platform without increasing their headcount.