Mastering Your SEO Dashboard: A Google Analytics Guide to Organic Growth


An seo dashboard for google analytics pulls all the search-performance data scattered across Google Analytics and Google Search Console into one clear, actionable view. Instead of juggling multiple tabs, you instantly see organic traffic, keyword performance, user engagement and conversions in a single place.
The demand for streamlined SEO reporting has never been greater. Although over 29 million websites use Google Analytics, many agencies still spend valuable hours switching between platforms and manually compiling spreadsheets. This fragmented approach drains productivity and makes it harder to show real ROI to clients.
A unified dashboard fixes the problem by automating collection and visualization. When your Google Analytics property is structured inside a well-built dashboard, reporting time can be cut by up to 50 percent.
As specialists in SEO automation, the Adaptify SEO team has seen first-hand how the right seo dashboard for google analytics can help agencies in Melbourne, Sydney, New York, and beyond scale their operations and deliver consistently stronger results. The rest of this guide explains how to build one.
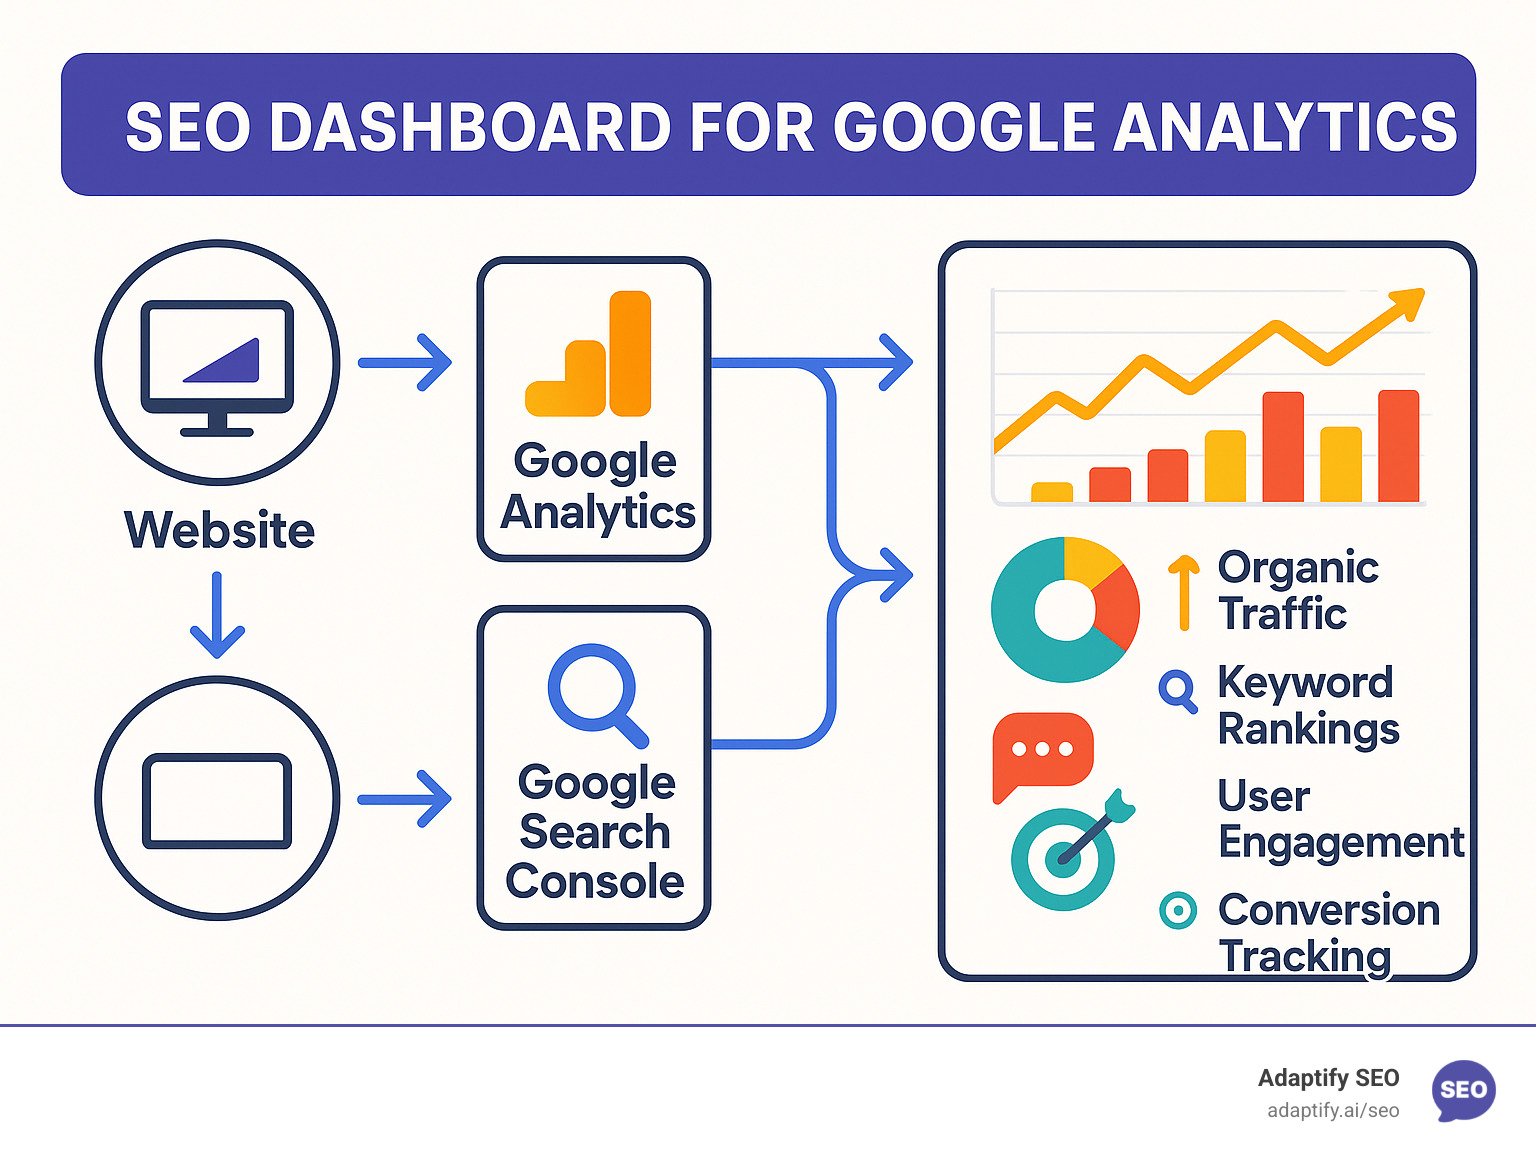
Managing SEO for multiple clients often means hunting for data across different platforms—Google Analytics for traffic, Google Search Console for keyword insights, and more. An SEO dashboard for Google Analytics ends this chaos. It’s a mission control center that unifies critical SEO data into one visual, easy-to-understand interface, showing organic traffic, keyword performance, and conversions in real-time.
Without a dashboard, you're flying blind. You might see a traffic increase, but you won't know which keywords drove it or how those visitors behaved on-site. A dashboard tells the full story behind the numbers, revealing what's working and where to focus next. For a solid foundation on optimization, see our guide on Essential SEO Best Practices for 2024.
A centralized SEO dashboard for Google Analytics transforms your workflow and client relationships by delivering:
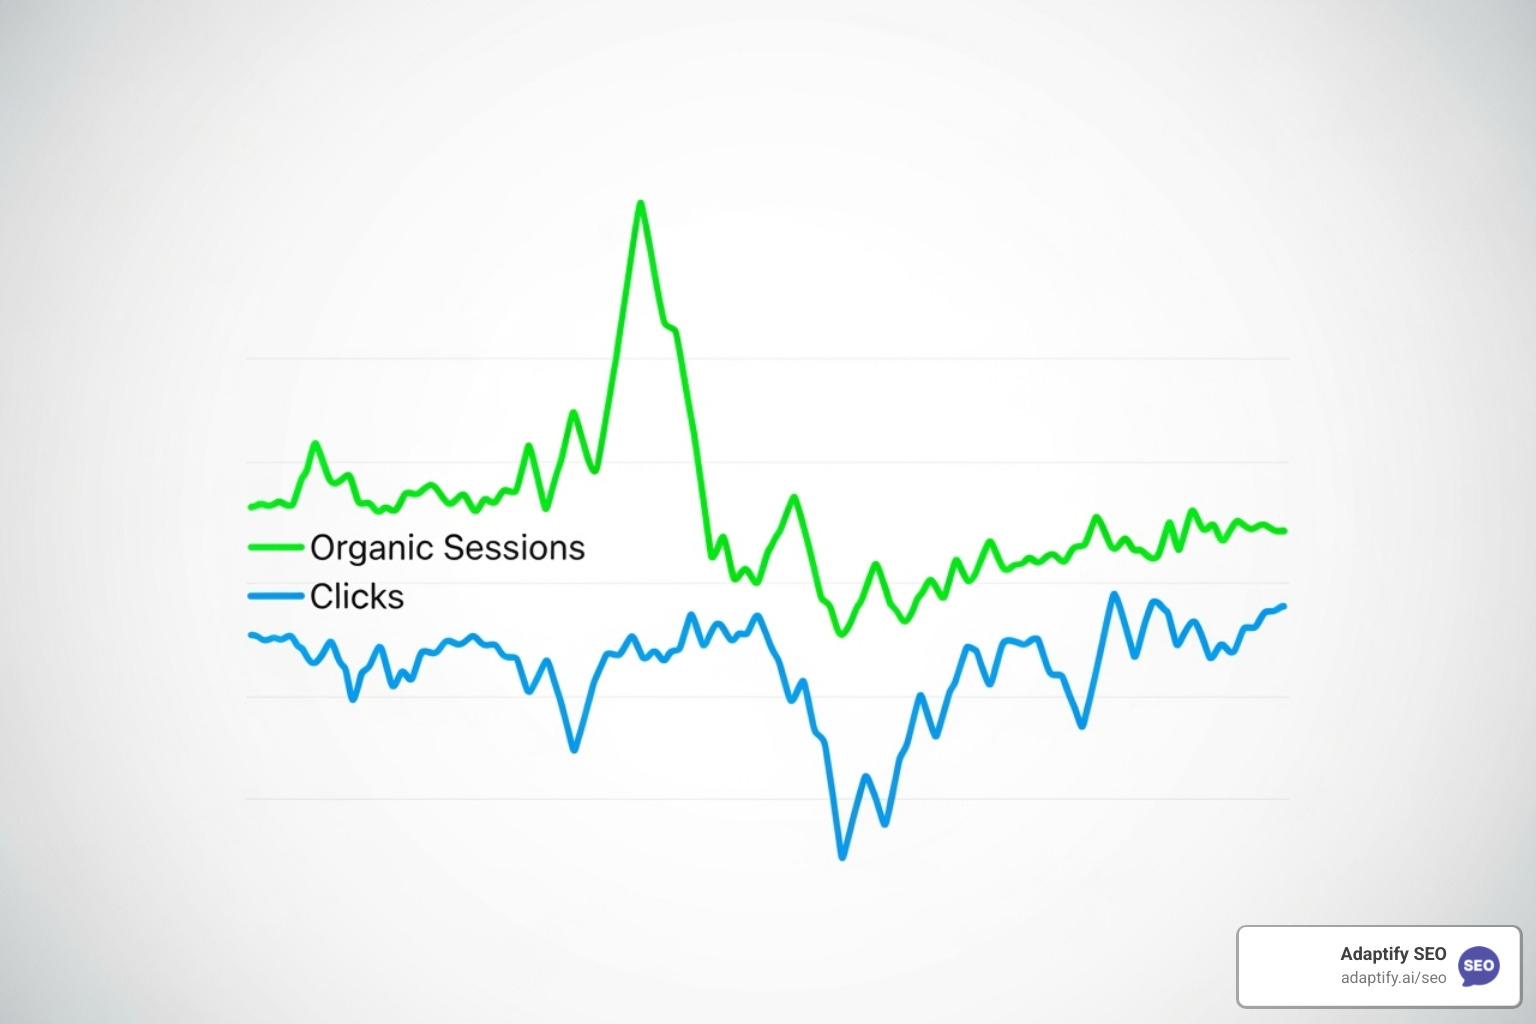
The real power of an SEO dashboard for Google Analytics comes from blending data from Google Analytics (GA) and Google Search Console (GSC).
When combined, you get the complete user journey. For example, you can see that users searching for a specific term (GSC data) landed on your site and then converted into a lead (GA data). This integration uncovers golden opportunities, like high-impression keywords with low CTR that need better meta descriptions. If you're new to GSC, our guide on How to Set Up Google Search Console for Your Website can help.
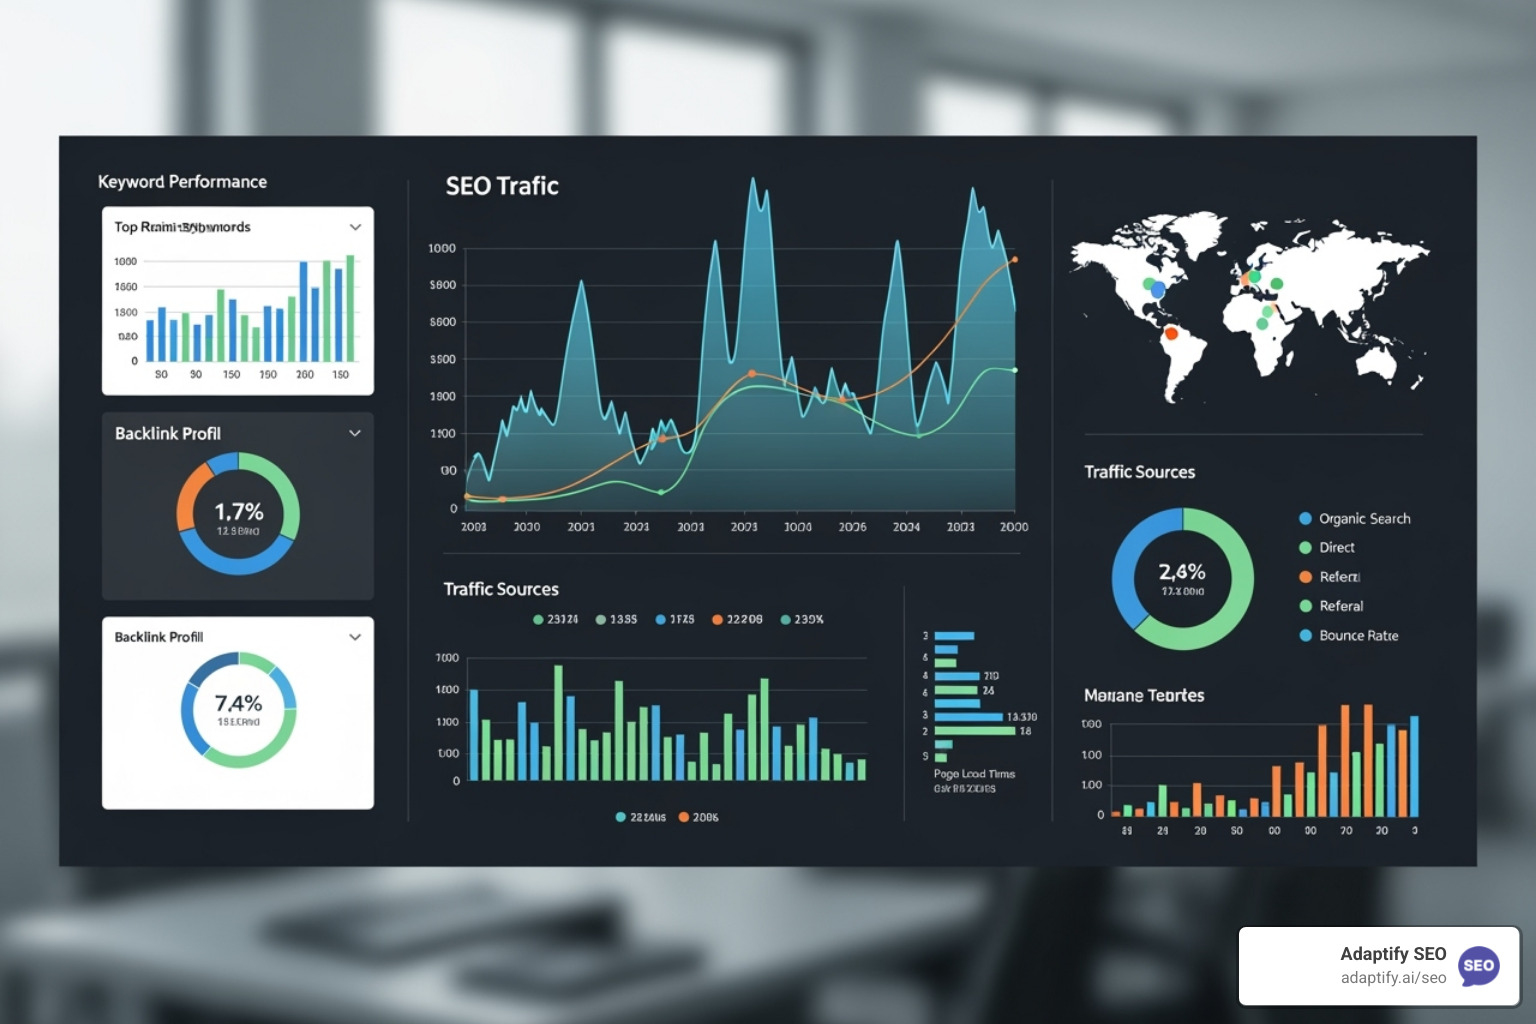
An effective seo dashboard for google analytics doesn't track every metric possible. It focuses on the key performance indicators (KPIs) that tell a complete story across three core areas: search visibility, on-site engagement, and business results. A well-designed dashboard connects these dots, showing not just that traffic increased, but that the new visitors were engaged and contributed to growth. For more on the tools that provide these metrics, see our list of the Top 5 SEO Tools You Need to Know.
These metrics are your SEO report card, showing how effectively you're appearing in search results and capturing traffic.
Once users arrive, these metrics reveal the quality of your traffic and whether your content meets their needs.
For more on GA4's new metrics, our Understanding Google Analytics 4: A Beginner's Guide has you covered.
This is where your seo dashboard for google analytics proves its business value by connecting SEO efforts to bottom-line results.
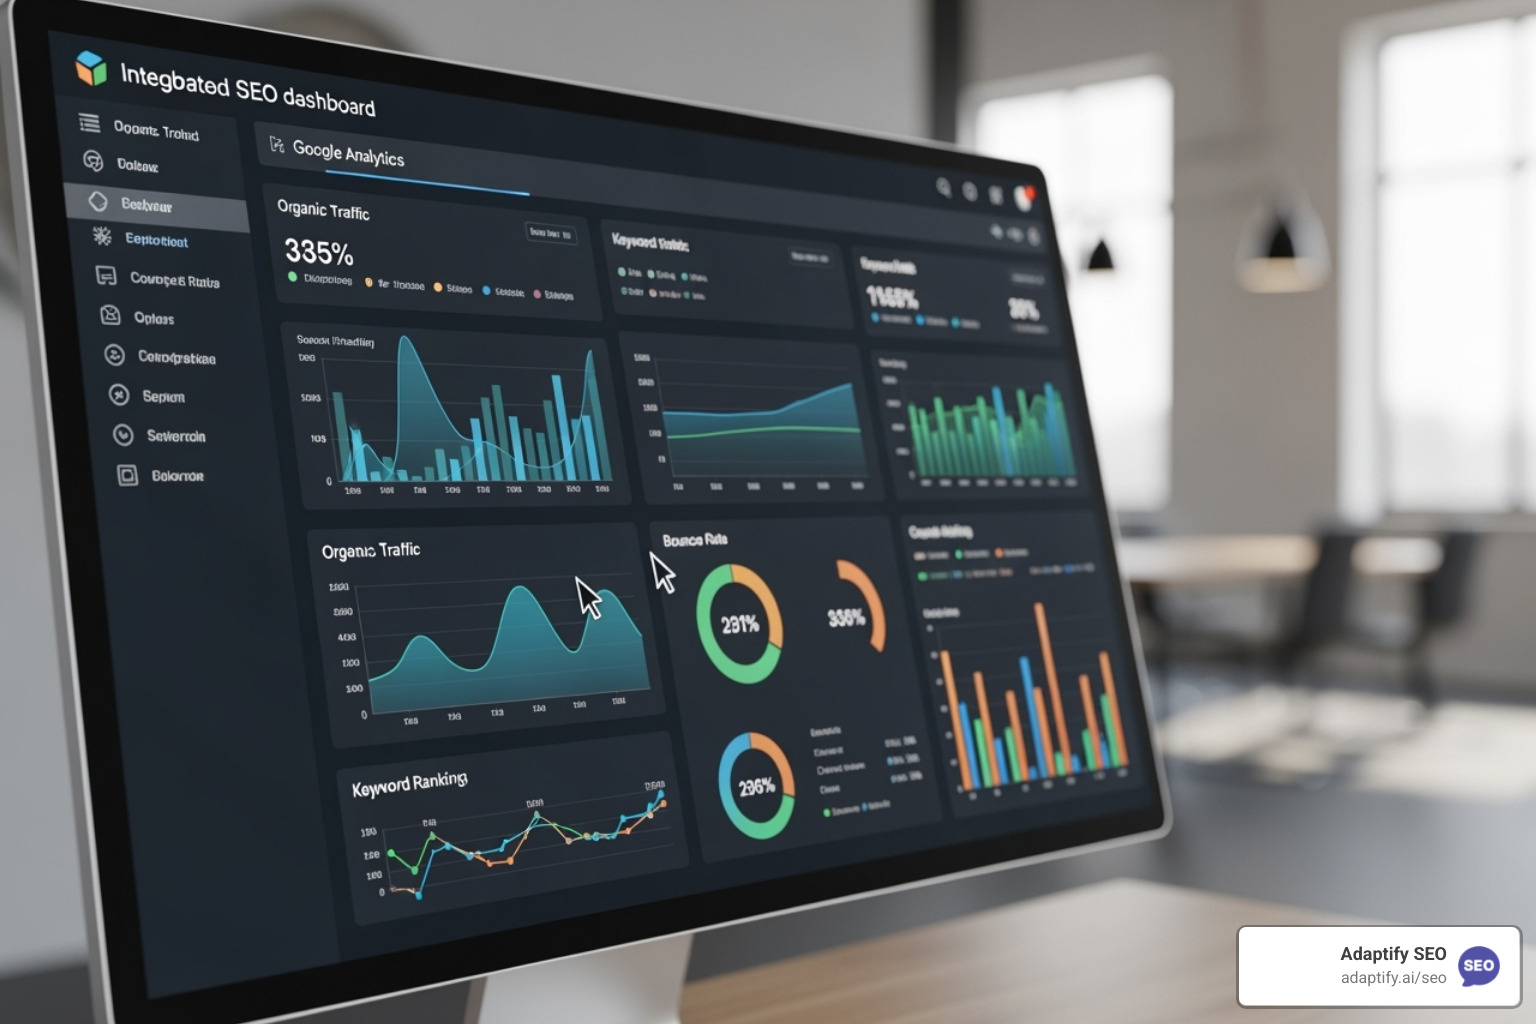
Building a powerful seo dashboard for google analytics is straightforward with the right tools. Our go-to platform is Looker Studio (formerly Google Data Studio). It's free, powerful, and integrates seamlessly with Google Analytics and Google Search Console, allowing you to create professional, insightful dashboards without being a data scientist.
While GA4's built-in reports are useful for quick analysis, they lack the customization and data integration features needed for comprehensive, client-facing dashboards. For agencies, Looker Studio is the clear winner.
| Feature | Native GA4 Reports | Looker Studio (Google Data Studio) |
|---|---|---|
| Dashboard Feature | No dedicated 'Dashboards' section | Yes, dedicated dashboard builder |
| Customization | Limited | Highly customizable layouts and charts |
| Data Blending | Limited to GA4 data | Can blend data from GA, GSC, and more |
| Data Sources | Primarily GA4 property data | Connects to nearly 500 data sources |
| Interactivity | Basic filters | Advanced filters, drill-downs, controls |
| Scalability | Good for single property analysis | Excellent for multi-client reporting |
Looker Studio's ability to blend data from multiple sources makes it indispensable for professional SEO reporting.
The foundation of your dashboard is data. In Looker Studio, add the Google Analytics Connector and the Google Search Console Connector, selecting your specific properties. The real power comes from data blending, which lets you combine metrics from both sources. For example, you can link GSC clicks to a landing page with GA engagement metrics for that same page. Looker Studio also supports API integrations with other tools, allowing you to pull in data like Core Web Vitals.
With your data connected, it's time to visualize it.
Always include interactive filters and date range controls to transform your dashboard from a static report into a dynamic tool.
You don't have to start from scratch. The Looker Studio template gallery offers pre-built dashboards for SEO. Simply find a template, make a copy, and connect your data sources. This gives you a professional starting point in minutes. For agencies, Adaptify SEO provides specialized dashboard templates designed to demonstrate SEO value and identify growth opportunities, helping you deliver professional results faster.
While an seo dashboard for google analytics is transformative, it's not without challenges. Even the best dashboards can face issues with data accuracy, scalability, and the infamous "(not provided)" keyword problem. Understanding these roadblocks is the first step to overcoming them. As one agency owner noted, addressing these issues helped them cut reporting time from 40 hours a month to under 20, "while providing even more detailed information."
For years, Google Analytics has hidden the specific keywords that drive organic traffic, labeling them as "(not provided)." This makes it difficult to attribute conversions to exact search queries.
The solution is to lean heavily on Google Search Console (GSC). GSC provides the query data that GA hides, including impressions, clicks, CTR, and average position. By integrating GSC data into your dashboard, you can reclaim crucial keyword insights. The focus should shift from exact-match keywords to understanding broader user intent and optimizing content around the long-tail query patterns you find in GSC.
Building one great dashboard is manageable. Building and maintaining dozens for multiple clients is a nightmare. This is the scalability trap many agencies fall into, leading to:
Manual reporting processes don't scale; they become exponentially more complex as your agency grows. This is precisely the problem Adaptify SEO was built to solve. Our automated platform helps agencies scale reporting efficiently by streamlining SEO processes with AI. We provide a comprehensive, automated solution that reduces manual effort, eliminates inconsistencies, and allows you to focus on strategy, not spreadsheets.
A powerful seo dashboard for google analytics is only the first step. The real value comes from using it to tell compelling stories that demonstrate clear ROI. Effective reporting isn't about overwhelming stakeholders with data; it's about creating a narrative that connects SEO activities to business outcomes. For more on this, see our guide on Mastering Data Analysis: Turning Analytics into Actionable Insights.
Great SEO reporting is data storytelling. Instead of just presenting numbers, you must provide context, highlight trends, and explain what the data means for the business. Don't just say, "Organic traffic increased by 20%." Instead, explain the 'why' and the 'so what': "Our content optimization efforts led to a 20% traffic increase, which generated 150 qualified leads and an estimated $45,000 in new revenue. This was driven by our target keyword 'enterprise software solutions' reaching position 3."
A one-size-fits-all dashboard doesn't work. Tailor the view to the audience:
The ultimate test of your seo dashboard for google analytics is whether it drives action. Use it to:
Here are answers to common questions about building and using an seo dashboard for google analytics.
The ideal frequency depends on your role:
Also, set up real-time alerts for major metric drops so you can react quickly to problems.
No, you cannot track competitor data directly within a dashboard built only with Google Analytics and Google Search Console. These tools only provide data for your own website. However, you can integrate data from third-party SEO platforms to pull in competitor insights. At Adaptify SEO, we provide strategic analysis that helps agencies understand the competitive landscape and identify opportunities to outrank rivals.
Though often used interchangeably, they serve different purposes:
In short, dashboards help you monitor performance, while reports help you communicate it. Both are essential.

Get help with local SEO to rank higher in Google Maps and dominate neighborhood search results.

Compare health insurance for entrepreneurs with ACA plans, tax deductions, and subsidies to protect your business and budget.

Master search engine optimization and marketing with proven SEO and SEM strategies that boost visibility, drive organic traffic, and deliv...
Join 1,000+ agencies already delivering SEO and AI visibility from a single platform without increasing their headcount.Join 1,000+ agencies already delivering SEO and AI visibility from a single platform without increasing their headcount.